Showing posts with label software - technology. Show all posts

Saturday, June 6, 2009

S3 Performance Benchmarks

Over the last couple of weeks we've been working with S3 to read data to power real-time user query processing. So we've made a lot of optimizations and measurements of the kinds of performance you can expect from S3.

S3 Throughput: 20-40MB/sec (per client IP)
20 MB/sec is the neighborhood for many small objects, with as much as 40 MB/sec for larger objects. We're pushing a lot of parallel transfers and range queries on the same objects. Each request is only pushing about 200 KB/sec. I don't think I've ever seen a single connection push more than 5 or 6 MB/sec. I'm assuming this is partly S3 traffic shaping. So this should scales well if you've lots of clients.
S3 Response Time: 180 ms
We're pulling from EC2 (just across the hall from S3?) We've seen response time range between 8ms (just like a disk!) and as long as 7 or 8 seconds. But under 200ms is quite reasonable to expect on average. We're pushing a lot of parallel requests (thousands per second across our cluster, with hundreds on individual machines).
Parallel Connections to S3: 20-30 or 120
20-30 roughly maximizes throughput, 120 roughly maximizes response time. S3 seems to do some kind of traffic shaping, so you want to transfer data in parallel. If you're hosting web assets (e.g. images) at S3 this is less of an issue since your clients are widely distributed and will hit different data centers. But if you're serving complex client data requests pulling data from S3 at just a few servers, you might be able to structure your app to download data in parallel. Do it with 20-30 parallel requests. More than that and you start getting diminishing returns. We happen to run more than that (perhaps as many as 100 per process, with as many as 1000 per machine) because we're focusing on response time, rather than throughput.
S3 Retries: 1
We do see plenty of 500 or 503 errors from S3. If you haven't, just wait. We build retry logic into all our applications and typically see success with even just one or two retries with very short waits. I should recommend exponential back-off (that's what the Amazon techs say in the forums). So if you're making more than one or two retries, start waiting a second, then two, then four, and so on. I'd bail and send yourself an email if you don't get a 200 OK after four or five retries and a minute of waiting. But maybe retry the first one right away, it'll work 9.9 times out of ten :)

If you're getting different results, do let me know :)

Sunday, March 15, 2009

Performance Measurement for Small and Large Scale Deployments

As well as powering a few cool tools, Linkscape is a data platform. Performance (and its measurement) isn't just important to reduce user latency, or cut costs. It's actually something we're hoping is part of our core competency, something that adds significant value to our startup. And the shortest path to performance is measurement.

For those in a hurry, jump straight to the tools we're using.

This post is inspired by (and at times borrowed from) an email I sent to some friends for a consulting gig I did recently. But it rings so true, and I come back to it so often, that I thought I would share it. Alex and Nick, I hope you don't mind me sharing some of the work we've done on your very neat, very fun Facebook game.

Let me motivate the need for performance monitoring with a couple of case studies taken from our infrastructure:

This dashboard (above) illustrates 28 hours of load on our API cluster. I can immediately see service issues on the first server (the red segment of the first graph). This is correlated with a spike in CPU and some strange request patterns on the second server (the layered, multi-colored bar on the graph below). The degraded service lasted for a few hours, which was a configuration issue I solved in our monitoring framework. It should have guaranteed downtimes of no more than 4 minutes.

Even after solving our monitoring issue I still needed to investigate the underlying issue: I can see the CPU and request pattern are related. Ultimately I solved this issue within two weeks. Without this kind of measurement I would not even have known we had an issue, and would not have had the data to solve it.

From part of our back-end batch-mode processing, we had thought we'd tuned our system about as well as we could. At times we were pulling data through at a very respectable pace, roughly 10MB/sec per node. but we had also observed occasional unresponsiveness on nodes, with a corresponding slowness in processing. We left the system alone for a while, thinking, "don't fix it if it ain't broke". But recently we've been tuning performance for cost reasons; so we came back to this system.

Once we instrumented our machines with performance monitoring (illustrated above) we saw that the anecdotes were actually part of a worrying trend: the red circles show this. Our periods of 10MB/sec throughput are punctuated by periods of extremely high load. The graphs above show load averages of 10 or more on 4 core nodes, along with one process spiking up to hundreds of megabytes and nearly exhausting system memory. This high system load dramatically reduced our processing throughput.

It turned out that the load was caused by a single rogue program which consumed all available system memory due to buffered I/O. Usually we have a few I/O pipelines and give each many megabytes for buffering. However, this program has many dozens of pipelines, altogether consuming nearly a gigabyte of memory. This lead to significant paging and finally thrashing on disk.

Once we reduced the size of buffers (from roughly 40-100MB per pipeline to just 1-2MB per pipeline) we saw dramatic improvements in performance: a nearly 60% boost! And the nodes have become dramatically more responsive—no more load averages of 10+. The graphs above show load average maxing out at 4 and plenty of memory available. The data suggest that we might even be able to nearly double our performance with the same hardware by increasing parallelism and running another pipeline on each node.

All of this work is powered by simple monitoring and measurement techniques. Sometimes this has lead to significant, but necessary engineering work. But sometimes it's lead to a single afternoon's efforts yielding a 60% performance boost, with an opportunity to nearly double performance on top of that.

We're using a few tools:

  • collectd measures the system health dimensions (cpu, mem usage, disk usage, etc.) and sends those measurements to a central server for logging.
  • RRDTool records and visualizes the data in an industry standard way.
  • drraw gives me a very simple web interface to view and manage my visualizations.
  • Monit watches processes and system resources, bringing things back up if they crash and sending emails if things go wrong.

These tools work together, in an open, plug-in powered way. I could swap out individual components and move to other tools, such as Nagios (which I've used for other projects) or Cacti (which I have not used).

Whether you're an on-the-ground operations engineer looking to watch system health and fix issues before they turn into downtime, or you're managing large-scale engineering, looking to cut costs and squeeze out more page or API hits, these tools and techniques point you in the right direction and give you hard data to justify your efforts after the fact. We've had many high ROI efforts initiated and justified by this kind of measurement.

Sunday, March 8, 2009

Why is this Report So Slow: Let the Database Handle the Data

We have a data-rich report in our Linkscape tool with even more in our Advanced Report. We think the data is great. But the advanced report can be awfully slow to load. Don't get me wrong, we think it's worth the wait. But this kind of latency is a challenge for many products, and clearly, there's room for improvement. We're finding improvements by porting logic from the front-end into the data layer, and by paging through data in small chunks.

We present our data (links) in two forms. One is an aggregated view, showing the frequency of anchor text, one attribute of each link:

We also present a paged list of links, showing all the attributes we've got:

The time we spend on each request is very roughly illustrated by this diagram. From it you can see each component in our system: disk access, data processing, and a front-end scripting environment. I've included the aggregate time the user experiences as well. We have a custom data management system rather than using a SQL RDBMS such as MySQL. But I list it as SQL because SQL presents the same challenge.

In total the user can experience between 15 seconds to three minutes of latency! The slowness comes from a couple of design flaws. The first is that we're doing a lot of data processing outside our data processing system. Saying that programming environment doesn't matter is a growing trend, which has some advantages; rapid development comes to mind. But (and I'm a back-end data guy, so I'm a bit biased) it's important to let each part of your system do the work it's best at. For presentation and rapid prototyping that means your scripting environment. But for data that means data processing.

We're currently working on moving data processing into our data layer, resulting in performance something like that illustrated in the diagram below. The orange bars represent time spent in this new solution; the original blue bars are included for comparison.

In addition to latency improvements, pulling this logic out of our front-end adds that data to our platform and consequently makes it re-usable by many users and by applications. The maintenance of this feature will then lie in the hands of our data processing team, rather than our front-end developers. And we've taken substantial load off of our front-end servers, in exchange for a smaller amount of extra load on our data-processing layer. For us this is a win across the board.

The other problem we've got is that we're pulling up to 3000 records for every report, even though the user has a paged interface. And those 3000 records are generated from a join which is distributed across our data management platform, involving many machines, and potentially several megabytes of final data pulled from many gigabytes of source data.

The other big improvement we want to introduce is to implement paging at the data-access level. Since our users already get the data in a paged interface, this will have no negative effect on usability. And it'll make things substantially faster, as illustrated (again very roughly) below. The yellow bars illustrate the new solution's projected performance. Orange and blue bars are included for comparison.

The key challenge here is to build appropriate indexes for fast, paged, in-order retrieval of the data by many attributes. Without such indexes we would still have to pull all the data and sort it at run-time, which defeats the purpose.

In the solution we're currently working on we've addressed two issues. First, we've been processing data in the least appropriate segment of our system. Process data in your data management layer if possible. Second, we've been pulling much more data than we need to show to a user. Only pull as much data as you need to present to users; show small pages if you can. The challenges have been to port this logic from a rapid prototyping language like Ruby into a higher-performance language like C or stored procedures, and to build appropriate indexes for fast retrieval. But the advantages of this work are substantial, and are clearly worth it.

These issues are part of many systems out there and result in both end-user latency problems, as well as overall system scalability problems. Fixing those problems results in higher user satisfaction (and hopfully higher revenue), and reduces overall system costs.

By the way, we haven't released anything around these improvements in performance yet. If you want to keep up to date on Linkscape improvements watch the SEOmoz Blog or follow me on Twitter @gerner.

Wednesday, March 4, 2009

High Performance Computing at Amazon: A Cost Study

In building Linkscape we've had a lot of high performance computing optimization challenges. We've used Amazon Web Services (AWS) extensively and I can heartily recommend it for the functionality at which it excels. One area of optimization I often see neglected in these kinds of essays on HPC is cost optimization. What are the techniques you, as a technology leader, need to master to succeed on this playing field? Below I describe some of our experience with this aspect of optimization.

Of course, we've had to optimize the traditional performance front too. Our data set is many terabytes; we use plenty of traditional and proprietary compression techniques. Every day we turn over many hundreds of gigabytes of data, pushed across the network, pushed to disk, pushed into memory, and pushed back out again. In order to grab hundreds of terabytes of web data, we have to pull in hundreds of megabytes per second. Every user request to the Linkscape index hits several servers, and pages through tens or hundreds megabytes of data in well under a second for most requests. This is a quality, search-scale data source.

Our development began, as all things of this scale should, with several prototypes, the most serious of which started with the following alternative cost projections. You can imagine the scale of these pies makes these deicions very important.

These charts paint a fairly straight forward picture: the biggest slice up there, on the colocation chart, is "savings". We spent a lot of energy to produce these charts, and it was time well spent. We built at least two early prototypes using AWS. So at this point we had a fairly good idea, at a high-level of what our architecture would be, especially the key costs of our system. Unfortunately, after gathering quotes from colocation providers, it became clear that AWS, in aggregate, could not compete on a pure cost basis for the total system.

However, what these charts fail to capture is the overall cost of development and maintenance, and many "soft" features. The reason AWS was so helpful during our prototype process has turned out to be the same reason we continue to use it. AWS' flexibility of elastic computing, elastic storage, and a variety of other features are aimed (in my opinion) at making the development process as smooth as possible. And the cost-benefit of these features goes beyond the (many) dollars we send them every month.

When we update our index we bring up a new request processing cluster, install our data, and roll it into production seamlessly. When the roll-over is complete (which takes a couple of days), we terminate the old cluster, only paying for the extra computing for a day or so. We handle redundancy and scaling out the same way. Developing new features on such a large data set can be a challenge, but bringing up a development cluster of many machines becomes almost trivial on the development end, much to the chagrin of our COO and CFO.

These things are difficult to quantify. But these are critical features which make our project feasible at any scale. And they're the same features the most respected leaders in HPC are using.

All of this analysis forced us to develop a hybrid solution. Using this solution, we have been able to leverage the strength of co-location for some of our most expensive system components (network bandwidth and crawling), along with the strengths of utility computing with AWS. We've captured virtually all of the potential savings (illustrated below), while retaining most of our computing (and system value) at AWS.

I would encourage any tech leaders out there to consider their system set-up carefully. What are your large cost compentents? Which of them require the kind of flexibility of EC2 or EBS? Which ones need the added reliability of something like S3 with it's 4x redundancy? (which we can't find for less anywhere else). And which pieces need less of these things? Which you can install in a colocation facility, for less?

As an aside, in my opinion AWS is the only utility computing solution worth investigating for this kind of HPC. Their primitives (EC2, S3, EBS, etc.) are exactly what we need for development and for cost projections. Recently we had a spate of EC2 instance issues, and I was personally in touch with four Amazon reps to address my issue.

Thursday, October 16, 2008

Lessons Learned while Indexing the Web

If you know what I've been working on for the last nine months, you might (correctly) suspect that I've learned a few lessons about developing large-scale (highly scale-able) and complex software. Let me share some thoughts I've got about the subject.

But before I begin, I should point out some aspects that make this a special project. I can't speak for the UI, and while everyone on the engineering team worked on the project in the final months, the development team—especially in the early stages—was small. Ben Hendrickson and I headed up architecture and the software efforts. We were the "core" team for the back-end efforts. So this made some things a lot easier. I'll comment more about this later.

Be Bullish (but Realistic) in the Planning Stages

One thing that helped us tremendously was to be broad and optimistic in the early stages. Doing this gave us a large menu of features and directions for development to choose from as plans firmed up and difficulties arose. I know the adage, "Under-promise, over-deliver." And there's a place for that mentality. When we did start to firm up plans, clearly we were not going to promise everything. But we tried to keep things as fluid as possible for as long as possible. This worked out for almost all of our features, and by the time we were half-way through with our project we had the final feature set nailed down, and prototyped out.

There was one substantial feature that we had to cut just a few weeks before launch. Perhaps we were too bullish, but I believe that this kind of thing is fairly normal for large software projects. I'm looking forward to working on that for the next release. ;)

Have Many Milestones and Early Prototypes

I wish we had had more milestones and stuck to them. The last couple of months were hellish with literally 14-16 hour days, 7 days a week. With my commute, there were many days that I arrived home, got into bed, woke up, and rolled back onto the bus to start it all over again. Despite reading about "hard-core" entrepreneurs who have this as a "lifestyle", I would not recommend it for a successful software engineering team.

We hit our earliest milestones and even had an early version about four months before launch. But the two milestones between that prototype and launch both slipped and no one stepped in to repair the schedule. So the rest of the team (including Ben and me, plus another six software engineers) had to take up the slack at the last minute. Missing these milestones should have told us something about the remainder of the schedule. Frankly, I think we were lucky to launch when we did (good job team!).

Low Communication Overhead = Success

We were lucky to have a small team. For the back-end it was basically just Ben and me. And we do all of the data management and most of the processing in the back-end. So it was easy for Ben and me to stay in sync. Add to that the fact that we work well together and we were able to achieve in a small team, what normally requires a much larger team.

While I've worked in much larger organizations, I've never had the leadership role in those organizations that I do now. So I can't say how much of this advice applies to larger organizations. I guess my feeling is the same that many people have: keep related logic together in small teams, have clear interfaces to other units. This worked well when we integrated with our middle-ware and front-end.

KISS

Anna Patterson describes a simple roadmap for building search engine technology. I'm not saying we followed this plan, but I can say that our (I hope successful) plan is equally simple. Identify the work you need to do. Come up with reasonable solutions. Plan and implement them. Don't get bogged down in hype or fancy technology.

There's certainly more to success than these points. These are just what come to mind when I think about the success of this project. In any case, good luck on your own projects!

Wednesday, March 19, 2008

First steps with Google Analytics & Webmaster Tools

After setting up Google Analytics and Webmaster Tools for your site, there are a couple quick settings and tweaks that I'd recommend:

  1. Set your preferred domain.
    Decide whether you want your website to be referenced with or without the www prefix (example.com vs. www.example.com). In your Webmaster Tools account, navigate to Tools > Set preferred domain and select the radio button next to your preferred version of your domain. I'll talk more soon about how to set this preference on your own server as well (so that anyone visiting your site will know which version you prefer).
  2. Remove yourself from your Analytics traffic reports.
    You probably don't want to include your own visits to your site in your reports. To fix this, create a filter in Analytics for each IP address from which you frequently access your site. I've created filters for my home IP address and my office IP address. Here's how to create the filter. If you don't know what your IP address is, a site like WhatIsMyIP.com can find it for you. Note that if you frequently access your site from a public location (such as a library computer or your local cafe), filtering out traffic from that IP address will also exclude from your reports anyone else visiting your site from that location.

If tools like Analytics freak you out, or you want to dig deeper but don't have the time, consider contracting an Analytics Authorized Consultant. These companies have in-depth knowledge of Analytics and can provide hands-on setup and support if the do-it-yourself style of the Help Center isn't enough for you.

Previous: Installing Analytics & Webmaster Tools

Thursday, February 28, 2008

Google Charts & Gadgets

I got a bee in my bonnet today to play around with Google Gadgets and Charts. The charts in Analytics are so beautiful that I wanted to play with sometihng similar on my own, so I decided to add a gadget to my iGoogle page showing my lap times from skate practice. Every month our coach times us skating 1 lap and 3 laps, so what better way to track my improvement than to throw it into a graph, right?

A word to the wise: although you'd think that gadgets would be an easy way to get started with Google Charts (whose Developer Guide is pages long and details dozens of URL parameters), I actually couldn't figure out how to make them work. The line graph gadget requires a field labeled "Data source URL", which means you need to encode the data you want to display using one of Google Charts' data encoding formats, which is non-trivial (especially for someone expecting the plug-and-play simplicity of most gadgets), and the gadget comes with no instructions whatsoever (do I need a full Charts URL? Just the data parameter? Can I add in additional chart parameters?). I spent long enough researching data encodings and chart URL parameters that I figured I might as well create my own charts from scratch rather than using the gadget.

Here's what I ended up with: Lap times The left axis shows my 3-lap times, the right axis my 1-lap times. I was actually surprised by how closely the curves match each other. I only have 2 months of data (I missed January), so I'm looking forward to a few more months' worth to see how the charts grow over time.

Monday, December 10, 2007

Best Practices: End Dating instead of Deleting

One of the things I've gotten out of one of my business parters in Vsched (that online employee scheduling software I'm working on), is a bunch of best practices relating to managing lots of data. One of these is using start and end dates on critical data, rather than actually deleting this data.

What my partner suggests doing is to use start_date and end_date fields containing effective-as-of and effective-until timestamps. Then, if you need to delete this data, you UPDATE the end_date field with the current timestamp instead of using a DELETE query.

It does make queries over this data more complex: you need to add another WHERE predicate (e.g. start_date >= NOW() AND (end_date IS NULL OR end_date < NOW())). So that might be an issue, but hopefully you're looking at best practices before you implement, and you can always worry about perf later, right ;)

So why would you want to do this? Well here are a few arguments:

This will provide your system a better audit trail. You want to know who did what to your customer data and when they did it. If you rely on the method described in my 5Ws of database design post, you'll lose that trail when you do your DELETE. But if you just UPDATE that row appropriately, you're safe.

This will also allow an undo feature for those nasty delete features users claim to want. I say "claim", because my users claim to want to delete their data. But I know as soon as I add the feature, I'll get a bunch of them accidentally deleting data. And what will they do when they delete it? They'll curse their bad luck. Then they'll email my tech support list. Then they'll send me an email. Then they'll call me. Right when I'm about to sit down with friends and a drink. So much for that evening. But wouldn't it be better if they could undelete their own data? Yes. It would be better.

Well, as a matter of fact, I've got such a delete feature. But I didn't implement it with DELETE. I used the above end_date scheme. And it works great. Except I forgot the front end :). So when that accidental delete happened, I still got the call. But I could check the end_date and last_updated_by fields. Long story short, I found those 300 deleted rows. And with a single UPDATE query we were back in business.

Thursday, December 6, 2007

Best Practices: The 5 W's of Database Design

My company's hosted employee scheduling software started with a prototype, which worked pretty well, but just wasn't ready for prime time. So my partners and I revisited our design documents, rewrote large portions of the code base, and rebuilt the database, almost from scratch. It hurt, but it was necessary to create a production system. In doing this, we followed some best practices. One of them is implementing the 5 W's of database design: who, what, when, where, why.

Ok, maybe we didn't quite get five Ws out of that. We've got a logging and audit system to cover where and why. But we do have who, what, and when. And it's come in handy a few times.

Every table in our database has a few special fields:
  • Creation Time
  • Created By
  • Last Update Time
  • Last Updated By

These four fields are on every tuple, and our application logic updates them appropriately. Once a user logs into our system we've got a user id. Any time he or she updates a piece of data, we store that user id and the current time. We've got a couple of features in the work to provide a front-end for this kind of information. But it's also helpful for debugging and providing support.

Earlier this week I rolled out a beta feature. Shortly after the rollout, I got an email from one of my users. There was some unexpected data floating around the system. After getting the user's permission, I took a closer look.

What had happened is that the new beta feature, let's say it was an easter egg painter, had mis-painted some eggs. Eleven out of twelve eggs had correctly been painted blue. But that twelfth egg had turned red somehow.

After groaning—this is the kind of bug that takes a lot of investigation—I dug a little deeper. I checked out the creation date of the eleven blue eggs. All of them were from just a couple of hours earlier, as expected. But that twelfth, red egg had been created a week earlier.

So I sent my user a friendly reply to her panicked email. I asked her if she had happened to create any red easter eggs last week, without the automated painter. And if so, had she accidentally mixed her blue, automatically painted eggs in with those red ones. About fifteen minutes later I got a reply saying, "oops, my mistake. Thanks Nick!"

Best practice to the rescue. Problem solved, without writing a single line of code. Well maybe just a little SQL.

Wednesday, December 5, 2007

How to Protect Against Cross Site Request Forgery

When dealing with security, I try to stick to tried and trusted practices since security is such a delicate topic. I'm not making any claims about the scheme I describe here. I'm only opening up a discussion. One of the security issues I'd like to address is cross site request forgery (CSRF).

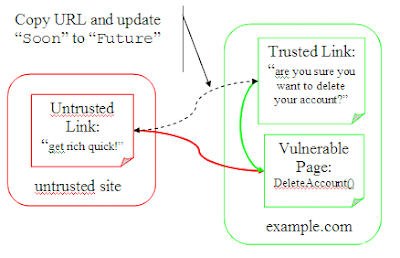
A CSRF is an attack where one site directs a user to another site in such a way that the second site thinks the request originated on a page from itself. To illustrate, suppose I put a link here with its href like so: http://www.example.com/​?c=DeleteAccount. If example.com isn't doing the right thing, and you click that link, then your account at example.com might be accidentally deleted. And the fact that example.com password protects your account won't necessarily help here if you're logged in in another window when you click the link. example.com has failed to adequately protect you.

So let me propose a scheme to address this vulnerability, and you can tell me what you think. Suppose example.com were to sign the request strings for the urls for its sensitive actions. That is, suppose instead of allowing the above url, it were to use this one: http://www.example.com/​?c=DeleteAccount​&k=SomeSig. Here SomeSig should be a signature of c=DeleteAccount (or perhaps the whole url).

Now a clever attacker would just have to get an account with example.com, find the delete account url, and grab the url (including the unforgeable signature). The problem has not changed at all. The attacker can just craft a forum post and wait for users to delete their accounts (or transfer funds to him/herself).

So let's ditch the signature and add an expiry to the url: http://www.example.com/​?c=DeleteAccount​&e=Soon. Here Soon is a timestamp after which you'd like to invalidate the url. Many sites log users out after ten or fifteen minutes, so pick something good inside of that. If you get an expired url, you can always have a warning that the url has expired and ask the user to click a new (similar, but updated) url. The idea is to force the user to understand what is about to happen.

Now if the attacker copies the url into a forum post the link will only be valid for some short time. Of course, the attacker can just update Soon to EndOfTime and we're back at square one.

But if we combine these two approaches (and add a nonce to make cracking the signature more difficult) we're a little bit better off: http://www.example.com/​?c=DeleteAccount​&e=Soon&n=Nonce​&k=SomeSig. Now we're signing the command and the expiry so that neither can be forged.

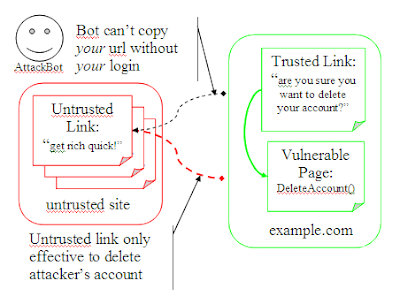
Of course, attackers can just keep going back for updated urls (or have a bot do it for them). But we've at least we've reduced the problem (unlike the previous two attempts).

The issue here is that we're continuing to trust an untrusted source. We have a trusted url (which can't be forged), but it only says, "delete account within my expiry". But what account should be deleted? We're assuming that we should delete the account of the user currently logged in. That makes some sense (we might not want to allow users to delete arbitrary accounts). But our unforgeable url makes no claims about which account to delete.

So let's have the url assert that too: http://www.example.com/​?c=DeleteAccount​&e=Soon​&n=Nonce​&u=UserID​&k=SomeSig. Now when you get this url, check that it's signed correctly, that it hasn't expired, and that the current user matches the user the url was created for. Our url asserts all of these things. And we can trust that all of these things are true, since the url comes with our own signature.

Again, I'm not making any claims that this "solves" the problem. This addresses some aspects of the problem. Feel free to correct any mistakes I've made; that's the point of this blog post. For instance, if an attacker does obtain this "unforgeable url", he or she can still embed it in a blog post and persuade a user to click the link within the expiry. At that point someone still loses an account. Ultimately a CSRF is still possible under this scheme. And there are probably some other weaknesses to the scheme as well. And I'd love to hear about them.

Anyway, I like this scheme so far. Mostly I'd like to use this scheme for 301 redirects after a form post-back with a confirmation: I'm trying to protect against forging the confirmation dialog. But the initial form post-back is just as vulnerable and should be protected also. What do you think?

Tuesday, December 4, 2007

Vsched.com Screenshots

I hope my last post whetted your appetite for the work I'm doing in online employee scheduling software. Now I want to show you a little bit of what I'm doing. So I've got a few screen shots to show off.

Of course, the heart of the system is a shift schedule manager. Above you can see a screen shot of part of a user's weekly schedule. I've covered up some of the info to protect the innocent, but you can see that different entries are color coded corresponding to their type (availability, preferences, work shifts, etc.). You can also see a variety of options available for a work shift, including finding a substitute to take the shift.

Here I'm adding a new unavailable time to my schedule. Our schedules support click and drag, just like any modern scheduling application.

Above you can see a nice summary of what kind of schedules are in place at the different locations and jobs. As you can imagine, work schedules need to change over the year, for example you might need more people to cover registers during the holidays. Also different locations will have different schedules.

This one is a new feature I'm working on right now to import users from a spreadsheet in CSV format. Loading employees into the system is one of the first things our customers do, so we want to make sure it's as easy as possible. You can also see a small bit of instruction in the green box. You'll find these throughout the system with helpful tips and reminders. Clicking on the question mark in the upper right (also available throughout the system) brings up some more in-depth context sensitive help.

We've also got some reports which give you aggregate information about your schedules. Here you can see who can take more hours on their schedule and how much of their schedule they actually wanted.

I'd better get back to work on that user import feature. I estimate around 1000 user clicks for the average setup without it! We're trying to make the lives of our customers easier. We don't want to replace one chore with another.

Monday, December 3, 2007

Introducing Vsched.com

I've been a bad, bad blogger for the last couple of months. But it was all for a good cause. I've been working (very hard) to get my new internet start up off the ground.

Vsched.com offers on-line employee scheduling software. We went live with our first customer, Cornell University Fitness Centers, over a month ago and everything has been running very smoothly since. They love the service, and we love having them. In the past couple of weeks and from here out we're bringing on-line other customers. So if you're interested, or know someone who schedules many employees, with many shifts, in different kinds of jobs, have them send us a note.

I'm going to try to blog more frequently about Vsched now that it's out. So let me begin by explaining exactly what it is we do.

Imagine that you've got dozens of employees with hundreds of shifts across different jobs and locations. Managing that many employees is a nightmare. You might be spending anywhere from 200 to 2000 staff hours a year doing scheduling. I know, I used to manage 90 student employees at Cornell. Creating shift schedules, keeping them up to date, and handling shift swaps is a real hassle for managers and employees alike. So my partners and I have put together an on-line application which automates these processes.

Managers can create and assign shifts with a click of a button, as well as get schedule reports and overviews. We make the right information available in all the right places, so you can find a substitute for a shift, or see a location or employee's weekly schedule with a single click. Employees can log in at any time from any where to update availabilities or schedule preferences, and to swap shifts. And the most current shift schedule is always available on-line. We even integrate with other calendaring applications such as Google Calendar to publish shift schedules to an employee's personal calendar.

One big feature I'm excited about is the automated scheduler. This kind of scheduling problem is very difficult. Computer scientists call this kind of problem "computationally infeasible". While I was a graduate student at Cornell University I spent a lot of time studying this kind of scheduling problem and came up with an algorithm that does a pretty darn good job. Cornell Fitness Centers tells me they anticipate cutting out 125 staff hours per schedule using the algorithm. So I'm pretty excited about that.

Another big feature I'm excited about is that the system is a hosted service, completely on-line. I was speaking with one customer who bought some boxed software over six months ago and still can't get his IT department to set it up for him. And I don't blame them. Maintaining a server, or client software is a hassle. With a hosted service there's no need for IT infrastructure; we take care of all the technical details.

Anyway, this is what I've been up to for the past month or so. I'm very pleased with the work my partners and I have done. I'm really looking forward to the next few months as we grow our customer base. I'll try and keep you posted on our progress.

Monday, November 5, 2007

Solving Tough Problems: mod_fcgid and Apache Errors

Almost two weeks ago I ran into some issues with my apache web server configuration running PHP under mod_fcgid. These issues started with an unexpected 403 Forbidden error, caused by a (13) Permission Denied error on my .htaccess file, and finally resulted in (due to my misconfiguration of PHP) a No input file specified error.

Since it caused me a great deal of headache, and took me a while to figure out, I thought I'd share with you my debugging process. Keep in mind, I'm a software developer, not an Apache sysadmin wizard. So you httpd wizards out there, feel free to correct me where I'm missing the obvious.

I'm running a MediaTemple (dv) 3.0 virtual server under Plesk. My problems started shortly after that with arbitrary 403 Forbidden responses to URLs I know should have worked. In fact, retrying the URL showed that it did work. As you'll see, the "sometimes works" part didn't last long.

The first step to solving a problem like this, or anything else, is to check logs. The Apache error log is the right log to start with. For me (MediaTemple (dv) 3.0 / Plesk) this was in the /var/www/vhosts/yourdomain.com/statistics/logs directory. Apart from the usual noise in log files I did see a pretty conspicuous line:

(13)Permission denied: [snip] .htaccess pcfg_openfile: unable to check htaccess file, ensure it is readable

This was pretty alarming because I had no .htaccess file in the particular directory indicated (the "[snip]" part). So I dug around on the internet for a while and found pretty much nothing of help about this problem. Keep in mind that everything was running just fine until this point. So I tried turning off AllowOverride in my global httpd.conf file (actually it goes in my vhost.conf file which Plesk includes for my virtual domain). I restarted Apache (service httpd restart) and much to my dismay, I started getting 403 Prohibited on every request. Yikes!

After finally digging through the MediaTemple knowledge base I found this little tidbit:

[...]permissions (755 or chmod o+x) on a directory created for alternate and subdomains is sufficient to serve web content. Anything else will prohibit Apache from entering the directory and showing your content to visitors.

So I did a stat on my http documents directory and I see:
Access: (0644/drw-r--r--)
One chmod o+x command later and my .html files are once again servable. Not sure what changed to cause the problem, but now everything was looking good and I was just about to close the issue as resolved.

Which brings me to the last problem I was getting on my PHP files: No input file specified. This started another round of fruitless internet searches. The bottom line is that this meant that PHP couldn't execute the file. Well, another stat command on the file in question showed:
Access: (0660/-rw-rw----) Uid: (1000/ someuser) Gid: ( 2000/ somegroup)
but more importantly neither the owner nor group for the file was associated with the suexec user that was being used for mod_fcgid. A quick chown -R suexecuser:suexecgroup command later on the folder holding my http files (-R makes it recursive) and my PHP file was working like a charm. Just make sure you replace suexecuser and suexecgroup with your actual suexec user and group (this is specified in my /var/www/vhosts/yourdomain.com/conf/vhost.conf file).

So in the end, to solve my "(13) Permission Denied" / "403 Unauthorized" / ".htaccess pcfg_openfile: unable to check htaccess file, ensure it is readable" / "No input file specified" errors I had to:

  • Check the Apache error_log file
  • Check the MediaTemple knowledge base
  • Use the stat (or ls) command to check file permissions and ownership
  • Use the chmod o+x command to make sure Apache can descend into any directory holding files you want served
  • Use the chown -R suexecuser:suexecgroup command to make sure Apache can access and execute your code

Wednesday, October 31, 2007

Google Tech Talk: Plurilingualism on the internet

Google hosts a surprising number of really interesting tech talks about language. Back in July I attended a particularly good one by Stephanie Booth, about plurilingualism on the internet. Here's the abstract:

More people are multilingual than purely monolingual. Yet the internet is a collection of monolingual silos. Where are the multilingual spaces? How can online applications assist the people who bridge the linguistic chasms, instead of hindering them? How do present applications decide what language to present? IP address or keyboard locale detection are clearly bad solutions. How could this be done better? This talk addresses some localization issues, but beyond that, questions the very way languages are dealt with on the internet.

It's definitely worth watching in full, but if you want the highlights, these are some of the more interesting ideas I took away from it:

  • Code-switching! I'd forgotten there was a term for it. Code-switching is awesome, especially as a form of word-play. Everyone should try it.
  • Stephanie is multilingual, and when she blogs she prefaces each post with a short summary in the language in which it wasn't posted (that is, posts in English get a synopsis in French, and vice versa). This lets her reach two language communities at once, without the tedium and mess of double-posting each post in full. Check out these recent examples.
  • "Some people really resent being shown languages they don't understand."
    Google develops software with a global reach, and we put a lot of care into trying to make sure users get our products in the right languages; but this quote was an interesting reminder that getting it wrong can provide a very negative experience for a particular user. Right now, for example, we use IP address as a factor in determining which version of Google search to show. If you're browsing from a US IP, we'll show you www.google.com in English; if you're browsing from a French IP, we'll show you www.google.fr in French. But what if you're browsing in Switzerland? We'll show you www.google.ch, but should we show the German, French, Italian, or Rumantsch version? We generally default to German, which—statistically—is the right answer, but for all the French/Italian/Rumantsch speakers is clearly the wrong answer. And what about someone from China who's road-tripping across Europe? She's probably going to want to see Google in Chinese, rather than being served a different language every time she logs on.
  • The lang and hreflang attributes are underutilized and offer some really cool potential for ways of understanding documents and hyperlinks. The most common use of lang is in the <html> tag, to define the language of an entire webpage: <html lang="en-US">. But you could also use it to define smaller subsections: stick it in a <blockquote> tag when you're quoting a different language; stick it in a <div> or a <p> if you have a section of text in a different language (for example, a summary at the top of a blog post!).

    The hreflang attribute is even more interesting to me, since I'd never heard of it before. From W3C:
    The hreflang attribute provides user agents with information about the language of a resource at the end of a link, just as the lang attribute provides information about the language of an element's content or attribute values.
    So if you link to a cool website in Spanish, you could throw <a hreflang="es" href="www.example.es"> in the <a> tag. The thing about these attributes, though—especially hreflang—is that they're underutilized because no technology takes advantage of them. But no technology takes advantage of them because they're underutilized. If we ever find a way to break out of this Catch 22, I could imagine some cool opportunities (visualizations for language targets, applications in search and social networking... the sky's the limit!).

Friday, October 26, 2007

Solving Tough Problems: Timezones and DST

I spent all my time putting out fires this week, and none of my time adding cool functionality. The trouble really started when I tried solving what I assumed to be common problems. But of course, when I tried to figure out how other people had dealt with these problems, I ran into a brick wall. Well, not a brick wall actually. Instead I found lots of "solutions". All of which took me forever to realize they had nothing to do with my problems.

The disaster actually started out as planned. I was working on some functionality dealing with calendar data (which is a difficult subject). This should be a simple thing. You've got a user in one time zone and another user in a different one? No problem. This isn't exactly a new problem. There should be support for such a thing in all this advanced technology. And it should be very natural to convert between them. And it should be natural to work with both computer oriented times as well as human oriented times. By which I mean the ridiculous practices we have of leap years, leap seconds, timezone offsets, and daylight savings times.

As it turns out, I needed to find different solutions for two operating systems, and three computing platforms (and I'm not even doing much AJAX yet). Just to give you a quick overview, most of the problems arise around counting the number of seconds in a day.

There's 86400 seconds in most days. But things get hectic with leap seconds and more importantly daylight savings time (which adds or subtracts an hour from two days a year). PHP provides the function strtotime which lets you do stuff like strtotime('+1 day') to add a day, taking into account daylight savings time so that today at 6:00am "+1 day" is 6:00am tomorrow. Combine this with date-default-timezone-set and you're ready to go, no matter where your users are.

Python, smug as always [ed: I love python], provides a timedelta class, assuming 86400 seconds in every day. This is as opposed to being timezone aware (even if you install and correctly use pytz). And it gets worse. You can convert from a UTC timestamp using the handy method datetime.fromutctimestamp. But how do you convert back? Is there a datetime.toutctimestamp? No, there isn't. What about the traditional mktime? That's only going to work if the datetime you're working with is in the system's timezone. And don't even try converting your datetime to the system's timezone. The only way to access the system's timezone is time.tzname which is non-standard and incompatible with pytz. I ended up using a combination of calendar.timegm and datetime.utctimetuple. No searches I tried found this solution.

Don't even get me started on MySQL. Check out this article on timezone support. And take a look at this list of date/time functions. But don't try using the timezone db they've got for download. It was inconsistent with all the olson zoneinfo databases I saw. I had to use mysql_tzinfo_to_sql on a Linux system and copy the resulting SQL script to my Windows box and apply it manually (mysql -u root -p mysql < zoneinfo.sql).

That's probably enough geeking out / ranting for this week. Next week I'll tell you about how I solved my very unexpected "(13)Permission Denied" / "403 Unauthorized" / ".htaccess pcfg_openfile: unable to check htaccess file, ensure it is readable" / "No input file specified" errors.

Saturday, October 20, 2007

Bookmarks and badges

Everyone love badges, right? The "Collect the whole set!" mentality is indoctrinated into us by cereal box giveaways and from Boy/Girl Scouting on up. Badges are cute and colorful and better yet, now that we're grown-ups we don't even have to do anything to earn them, we can just grab them off the web. :-P

So we've added a variety of bookmarking and web 2.0/social software-type badges to our posts. Yeah, I know, we're behind the times on this and some people just find it tacky; but, well, it's an experiment. Please let us know whether you find them useful, garish, and/or if there are any we should add (or any you think are a waste of space)!

Credit to 3spots for pointing me in the right direction.

Monday, October 15, 2007

InfoCamp 2007: Wrapup

I don't know if I have a whole lot to say that I haven't already. You can see all the posts I made from InfoCamp Seattle 2007 by checking out my infocampseattle2007 tag.

The event was great. I met some great people like the keynote speaker, Nick Finck, the plenary speaker, Bob Boiko, some of the organizers, Aaron Louie and Kristen Shuyler, and some innovative librarians, such as Whitney Edwards and Justin Otto.

My second session on short cut access to information was cancelled since there were only about 20 people left by the end of the second day and there were about 4 sessions competing for them. But I did get to attend a session that showed an example where a lot of work got done without enough user research and led to a lot of unanswered questions about how to proceed.

At the end of the day we had "five minute madness" where we all shared a few comments about what we liked, what we didn't like, and what we learned. Nick Finck pointed out what a great ROI we got from this un-conference: the whole thing cost $20 for registration, we got two days worth of breakfast and lunch, tons of sessions, a great keynote and plenary, and we got to meet a lot of smart people from across the information ecosystem. And he's totally right. InfoCamp Seattle 2007 was supported in a big way. From the InfoCamp Seattle 2007 wiki:

  • ASIS&T - The American Society for Information Science & Technology
  • UW iSchool
  • Information Architecture Institute
  • Ascentium - interactive marketing and technology
  • Blink Interactive - user experience consulting
  • Digital Web Magazine - online magazine for web designers, web developers and information architects
  • One Economy - a nonprofit organization that brings broadband to the homes of low-income people
  • ZAAZ - web design services with technical and creative design
  • Ginger Palace Restaurant - sponsor for lunch on Saturday

Sunday, October 14, 2007

InfoCamp 2007 Live: Plenary by Bob Boiko

Day two at InfoCamp Seattle 2007 is underway. We began the day with a YouTube video titled "Information R/evolution". It's pretty slick:

We just got a very interactive (reminds me of my best lectures back at Cornell) plenary session delivered by Bob Boiko, instructor at University of Washington's Information School, author of the Content Management Bible and Laughing at the CIO, and president of Mediatorial Services.

Bob started with a quote from the cover of an issue of (the now defunct) Business 2.0 magazine: "Forget everything you know about business". He argues that we don't actually throw away old information. In fact, he argues, we "reinvent, refine, [...] and rearrange" information, building on what has come in the past.

The plenary consisted of trying to answer the question, who are we as information professionals? A couple of highlights from the answers he elicited:

  • We make the process of accessing information easier
  • We deliver information of high quality
  • We elicit the right question from users to answer their questions
  • We improve the experience of finding the question and then answering that question
Bob rounded all this out with the statement:
We hook up the knowers with the want-to-knowers.

However, he argues that this process needs to be personal and typically should involve lots of people. He argues that there are tons of idle brains around; "this is not a limited resource" he says. This sounds a lot like the current trends in social sites (a.k.a. web 2.0).

Then there's the notion of "cross pollinators" which Arron Louie brought up while introducing the key note. Regarding this, Bob asked three questions:

  • Are we cross pollinators?
  • Is that valuable?
  • How do we do it?

Regarding the first two, we all agreed that the answer is yes. As for the third, that's what this BarCamp is all about!

In fact, Bob asked me to give a session about making access to information "easier" (in this case, faster). This was after I brazenly argued that I know how to speed up access to a specific type of information by an order of magnitude in all cases. I think I'll call the session "Shortcuts to Information: Increasing Time to Access by an Order of Magnitude". By the way, an order of magnitude may just be a rhetorical device in this case...

Saturday, October 13, 2007

InfoCamp 2007 Live: My Session on Calendaring

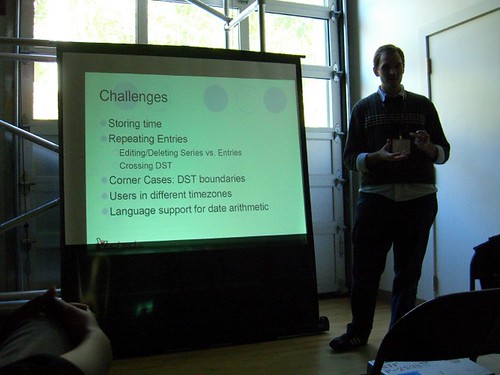
For my participation at InfoCamp Seattle 2007 I presented some user interface issues with calendaring systems which is something I've been doing for a while now. I'm far too modest to go into too many details (maybe I'll write a blog post about it in more detail later, plus I'm dead tired after Thingamajiggr last night, and a full day of InfoCamp), but below is a quick overview of some of the problems I'm interested in investigating and addressing. I also looked at some different calendaring systems and programming languages with regards to how they address these issues.

  • Storing Time
  • Storing Repeating Entries
  • Editing and Deleting Repeating Entries
  • DST and Repeating Entries
  • Entries on the DST boundaries
  • Users in multiple timezones (especially when not all observe DST)
  • Programming Language Support for Date Arithmetic

So that sums up day one of InfoCamp Seattle 2007. So far, so good. By the way, my Lenovo Thinkpad X60's battery performed admirably: after a full day of note taking, blogging, and presenting I'm at 47% with an estimated three hours and 21 minutes remaining. Not too shabby.

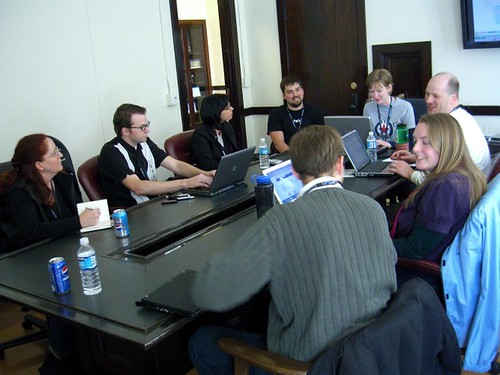
I should also point out that I'm using photos (most graciously thankfully for) from Kristen Shuyler, one of the organizers of InfoCamp. You can find more at Flickr tag infocampseattle2007.

InfoCamp 2007 Live: Gateways to Information and Information Technologies in Public Libraries

The first session I attended at InfoCamp 2007 was titled "Gateways to Information" presented by Justin Otto, a librarian at Eastern Washington University. He was primarily interested in investigating how to bring the often vast information resources at libraries to library patrons. In fact this is a topic of interest to many of this weekend's participants, many of whom are librarians.

The session was part feedback session for EWU's library website, and part general discussion on accessing large amounts of information from many different (and often walled-garden style) data stores.

Consider the many kinds of information available at a library:

  • Library Catalogue
  • Research Databases (such as JSTOR and ProQuest)
  • Subject Guides
  • Library Events
  • Information About Local Organizations

It seems as if most of these libraries traditionally present the user with lists of links (dozens), sometimes categorized, but typically along single dimensions (such as subject areas). Often there are search facilities, but either the search is not a unified or federated one (meaning you must already know what data store you're searching under first) or the search facility provides poorly ranked results (perhaps due to poor result integration).

My fellow session participants and I came up with a few general principles which we find useful:
Unified Search
Make all information from the library (events, catalog, research databases, etc.) available from a single search interface, with high quality results integration. Make this search facility available on every single page.
Bread Crumbs
Someone brought up Steve Krug's infamous Don't Make Me Think with respect to his comments on creating a bread crumb trail to help users navigate a site.
Card Sort Analysis
This is one I hadn't heard of before, but someone suggested placing content areas on cards, handing the cards to users, and asking them to categorize the content into a hierarchy. Given the amount of content at a library and its complex relationships, this seems like an excellent technique to get a feel for how users might want to navigate subject areas.

I stayed for a second session on Information Technology in Rural Libraries given by Whitney Edwards, Elliot Edwards, and Katy Herrick of the Libraries of Stevens County in Eastern Washington. It sounds like they're addressing some interesting problems with some innovative techniques.

Stevens County has nine very rural libraries, each with different resources and its own collection. The population of Stevens county is technologically literate (seemly very much so!); however, the internet service opportunities in Stevens County seem to be limited. Most patrons of the library have only dial-up access.

Whitney and her colleagues provide several important services to their community. A very popular one is high-speed internet access (available wirelessly). The Stevens County librarians also maintain a wiki for the library that also performs as a local organization repository.